Views: 0 Author: Site Editor Publish Time: 2026-05-31 Origin: Site
Oil contamination goes far beyond a simple maintenance nuisance. It operates as the leading root cause of premature hydraulic and rotary equipment failure across modern industries. Microscopic particles act like tiny daggers inside your machinery. They silently destroy critical components before operators even notice a problem. Traditional lab analysis remains highly valuable for deep diagnostic work. However, modern operational demands require a much faster response. We must minimize the latency between contamination events and maintenance actions. Relying solely on delayed laboratory reports leaves high-value assets exposed to catastrophic breakdowns.
Our goal is to provide reliability engineers and procurement teams with a clear, evidence-based framework. We will help you evaluate, select, and deploy the right strategy. You will learn how to match specific monitoring technologies to your exact asset criticality. This guide ensures you catch microscopic threats before they cause irreversible mechanical damage.
Relying solely on delayed laboratory analysis leaves critical equipment vulnerable; up to 45% of off-line lab results flag issues only when failure is already imminent.
Effective oil contamination monitoring requires a hybrid approach: online sensors for real-time trending and alerts, paired with lab tests for root-cause diagnostics.
Choosing between an online oil particle monitor and a portable oil particle counter depends strictly on asset criticality, accessibility, and budget.
Tracking relative moisture saturation (%) is often a more reliable indicator of free-water risk than measuring absolute water volume (ppm) due to temperature and aging fluctuations.
Industrial operators often rely heavily on off-site lab analysis. Technicians take a bottle sample, mail it away, and wait for the results. This traditional method creates a dangerous latency period. During this delay, microscopic particles continue circulating through the fluid system. You might wait seven to fourteen days for a report. In that time, sudden spikes in wear metals or moisture can trigger severe internal damage. Secondary contamination during the manual sampling process also skews results frequently. Dirt from the environment easily falls into the sample bottle, causing false alarms.
You must understand the exact cost of micro-pitting. Particles sized between 2 and 40 microns are highly destructive. They perfectly match the dynamic clearances of most hydraulic and lubrication films. When these tiny contaminants enter tight spaces, they bridge the lubrication gap. They gouge metal surfaces and create microscopic craters. This abrasive wear generates even more particles, creating a rapid chain reaction of degradation.
Continuous monitoring shifts your focus to concrete outcomes. Real-time insights allow you to transition securely to condition-based oil changes. You extend service intervals because you only replace fluid when it actually degrades. This prevents catastrophic pump and valve failures entirely. Furthermore, you reduce environmental waste by discarding oil only when necessary. To complement this modern approach, periodic contamination testing in a lab confirms your baseline health and provides deep root-cause identification.
You cannot manage what you do not measure. Fluid health relies on three core parameters. Every reliable maintenance program must track these factors continuously.
Industry standards use the ISO 4406 cleanliness code to quantify dirt and wear debris. This standard assigns a three-number code based on exact particle size thresholds. It counts particles greater than 4 microns, 6 microns, and 14 microns in one milliliter of fluid. For example, a code of 18/16/13 tells you exactly how many particles exist at each size level. A drop in one code number means the particle count has halved.
ISO Code Number | Particles per mL (More than) | Particles per mL (Up to) |
|---|---|---|
18 | 1,300 | 2,500 |
16 | 320 | 640 |
13 | 40 | 80 |
Water destroys lubrication chemistry. It exists in three distinct states: dissolved, emulsified, and free. Dissolved water remains invisible, much like humidity in the air. Emulsified water makes the oil look milky. Free water separates entirely and pools at the bottom of the reservoir.
We recommend measuring relative humidity or percentage of saturation. Absolute water volume measured in parts per million (ppm) changes meaning based on temperature. Hot oil holds more dissolved water than cold oil. As oil ages, its saturation point shifts drastically. Tracking the percentage of saturation provides a much clearer indicator of free-water risk. It tells you exactly how close the fluid is to forming dangerous free water droplets.
Fluids lose their protective properties over time. You must monitor changes in the dielectric constant. This electrical property reveals oxidation and additive depletion. It also flags sudden external fluid ingress. If a cooler cracks and leaks glycol into your hydraulic system, the dielectric constant spikes immediately. Combining this metric with temperature tracking gives you a complete picture of chemical health.
No single technology solves every reliability challenge. You must build a framework using the right combination of tools. We categorize these frameworks into three main tiers based on deployment style.
Traditional lab analysis serves as your deep diagnostic baseline. Laboratories utilize advanced techniques like FTIR, Karl Fischer titration, and mass spectrometry. They identify specific additive degradation and exact wear metal compositions.
Pros: Highly comprehensive and precise. Excellent for determining the exact metallic makeup of wear debris.
Cons: High latency between sampling and results. Manual sampling errors often skew the data.
Best for: Deep root-cause analysis after an online sensor triggers an alarm.
Portable tools bring the laboratory directly to the machine side. Technicians carry these devices during their regular inspection routes. They connect the device directly to a quick-connect test port.
Pros: Immediate results at the asset. You avoid sample bottle contamination. It suits route-based maintenance programs perfectly.
Tooling: Utilizing a portable oil particle counter across multiple non-critical or semi-critical machines proves highly economical.
Cons: The process still requires manual labor. It only provides snapshots in time rather than continuous, uninterrupted trends.
Modern industrial operations increasingly rely on permanent sensor installations. You mount these units directly onto the machinery. They sample the fluid continuously as the machine operates.
Pros: 24/7 visibility into fluid health. This approach eliminates human sampling errors completely. It triggers SCADA or PLC alarms well before catastrophic mechanical damage occurs.
Tooling: Deploying a dedicated online oil particle monitor on highly critical, high-capex assets delivers maximum protection. We strongly advise this for turbine bearings, primary hydraulic presses, and large gearboxes.
Selecting the right sensor technology dictates the accuracy of your program. Different environments require distinct detection methods. Understanding how these sensors work helps you avoid misapplications.
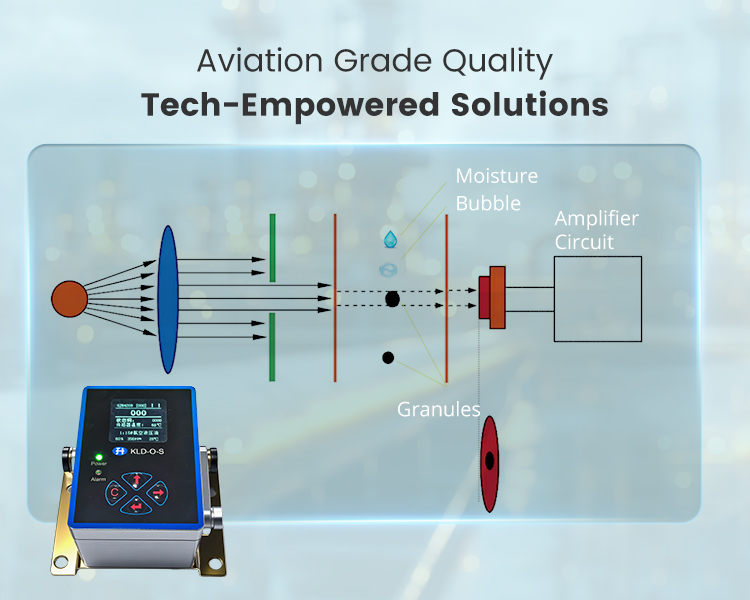
Optical sensors remain the industry standard for precise ISO 4406 particle counting. They project a laser beam across a small fluid channel. As particles pass through, they block the light and cast shadows on a photodiode. The sensor calculates the size and quantity of these shadows.
You must understand their inherent limitations. Basic optical sensors can be tricked easily. Air bubbles and emulsified water droplets cast shadows too. The sensor might count these as solid dirt particles, causing false alarms. In highly aerated systems, an advanced oil particle water analyzer uses sophisticated compensation algorithms to distinguish between solid debris and air.
Dielectric sensors measure the overall electrical capacitance of the fluid. Clean oil acts as an insulator. When wear metals, water, or oxidation byproducts build up, the fluid conducts electricity differently. These sensors excel at detecting sudden changes in fluid chemistry. If a massive water ingress event occurs, the dielectric sensor registers the anomaly instantly.
These specialized units focus exclusively on water content. They feature a thin polymer layer placed between two electrodes. The polymer absorbs water directly from the oil. The sensor measures the resulting change in capacitance. They are specifically tuned to measure the relative humidity of the fluid. This gives you the crucial percentage of saturation metric we discussed earlier. You avoid the confusion caused by temperature fluctuations.
Heavy wear environments pose unique challenges. Large gearboxes generate dark, heavily oxidized oil. Optical lasers struggle to shine through such opaque fluids. Inductive debris monitors solve this problem. They generate a magnetic field across the flow pipe. When a ferrous metal particle passes through, it disrupts the magnetic field. The sensor quantifies this disruption. Best of all, it ignores non-magnetic dirt, air, and water. You might integrate this technology within a robust online oil particle monitor to target severe gear wear exclusively.
Buying the hardware represents only the first step. Installation and data integration determine the ultimate success of your monitoring program. Avoid common rollout failures by addressing these realities upfront.
You face two main plumbing choices. In-line installation places the sensor directly inside the main pressurized flow. This exposes the sensor to extreme pressure spikes. You must evaluate the pressure drop and flow rate requirements meticulously. If the sensor restricts flow, you starve critical components of lubrication.
We recommend on-line bypass installations for most industrial applications. A bypass loop siphons a tiny fraction of fluid from the main line, passes it through the sensor, and returns it to the reservoir. Bypass loops are generally much safer. You can retrofit them easily without disrupting main system pressure. They also protect sensitive optical lenses from aggressive pressure surges.
Fluid temperature impacts every physical property of the oil. Sensor readings fluctuate wildly if the fluid heats up or cools down. Dielectric and moisture measurements remain particularly vulnerable to this effect. You must ensure your sensors feature strict internal temperature compensation. The hardware must correlate the raw measurement with the current fluid temperature. Without this automatic adjustment, your control room will suffer from constant false alarms during morning start-ups or hot afternoon shifts.
Isolated data provides zero value. You must route sensor outputs into your existing infrastructure. Determine how the hardware communicates before purchasing. Industry-standard protocols include Modbus TCP, CANopen, and analog 4-20mA signals. Work closely with your controls engineer. Map these data registers directly into your existing CMMS or SCADA system. Maintenance teams need this data displayed on the dashboards they already use every day.
Alert fatigue destroys condition-monitoring programs. If alarms ring constantly, operators eventually ignore them. You must configure a disciplined, three-tiered response mechanism.
Target Level: The normal operating baseline for the specific machine.
Warning Level: A slight elevation above normal. This triggers increased manual observation and prompts a scheduled lab sample for verification.
Critical Level: A severe spike indicating imminent mechanical failure. This triggers an immediate system shutdown or automatic filtration flushing loop.
You need a structured plan to deploy these technologies effectively. Follow this four-step logic to ensure a smooth procurement and implementation cycle.
Audit Asset Criticality: Do not put a continuous sensor on every machine. Classify your machinery carefully. Place Tier 1 continuous monitors on highly critical assets where failure stops production. Use Tier 2 portable testing for semi-critical secondary equipment. Rely on Tier 3 periodic lab sampling for non-critical, easily replaceable components.
Define Fluid Constraints: Identify the specific fluid types in use. Note their operating temperatures, viscosity grades, and baseline cleanliness targets. High-viscosity gear oils require different pumping solutions than thin hydraulic fluids.
Evaluate Vendor Software: Investigate the data ecosystem. Does the hardware require proprietary software subscriptions? We strongly prefer open-protocol architectures. Open systems allow for easy Industrial IoT integration and give you complete ownership of your data.
Run a Pilot Program: Never attempt a plant-wide rollout immediately. Identify one or two chronic "problem" machines. Install your chosen oil contamination monitoring equipment on these specific assets. Prove the financial and operational benefits locally. Use the success of this pilot to justify the budget for broader plant implementation.
Modern industrial reliability depends entirely on a proactive mindset. You must shift away from reactive, calendar-based fluid changes. Condition-based maintenance saves resources and prevents sudden mechanical disasters. The technologies we covered today offer distinct advantages based on your specific operational constraints.
Emphasize the complementarity of these tools. Continuous online sensors act as the nervous system for your machinery. They provide immediate threat detection and alert you the moment fluid quality drops. Meanwhile, periodic laboratory testing serves as the deep health check. The lab identifies the exact root cause behind the sensor's alert.
Take action immediately. Walk your plant floor and assess your highest-risk hydraulic or lubrication system. Calculate the hourly downtime cost of that specific machine. Evaluate a pilot installation of a real-time monitor on that asset. Securing your critical fluids secures your overall production output.
A: Vibration analysis detects mechanical anomalies like unbalance and misalignment. It usually catches these issues only after physical wear has begun. Oil analysis detects chemical breakdowns and microscopic abrasive particles before they cause that mechanical wear. They function as highly complementary technologies. Oil analysis identifies the early cause, while vibration analysis confirms the physical symptom.
A: Particles in the 2 to 40-micron range remain the most destructive. They are small enough to enter dynamic clearances between moving parts. However, they are large enough to bridge the fluid gap. This causes severe abrasive wear and micro-pitting on sensitive valve spools and pump bearings.
A: High-end optical sensors utilize advanced algorithms and shape-recognition technologies to ignore air bubbles. However, heavy aeration still challenges basic laser counters. In highly aerated systems, we recommend using inductive sensors or installing proper de-aeration sampling chambers to ensure accurate counts.