
Views: 0 Author: Site Editor Publish Time: 2026-10-13 Origin: Site
Industrial fluid systems are undergoing a massive transformation. We are moving rapidly away from traditional time-based maintenance towards proactive condition-based monitoring. Relying solely on periodic offline lab sampling creates a dangerous blind spot for critical rotating equipment. High-value machinery can easily experience catastrophic breakdown between scheduled monthly tests. You simply cannot manage what you cannot see in real time.
We introduce the online debris monitor dc series as a continuous evaluation tool. It effectively bridges the gap between reactive component failure and proactive reliability. This technology acts as an always-on sentinel for your machinery. This guide evaluates operational mechanics, integration realities, and the business case for transitioning to real-time wear monitoring. You will learn how to implement these systems accurately and optimize your fluid maintenance strategies.
Continuous oil condition monitoring captures transient wear events that 30-day laboratory sampling intervals miss.
The online debris monitor DC series provides real-time differentiation between ferrous and non-ferrous particulate generation, enabling root-cause diagnostics.
Successful implementation requires strict alignment between sensor sensitivity, fluid viscosity, and existing CMMS/SCADA data architectures.
Deploying these sensors shifts maintenance from schedule-driven fluid changes to data-justified interventions, directly reducing unplanned downtime.
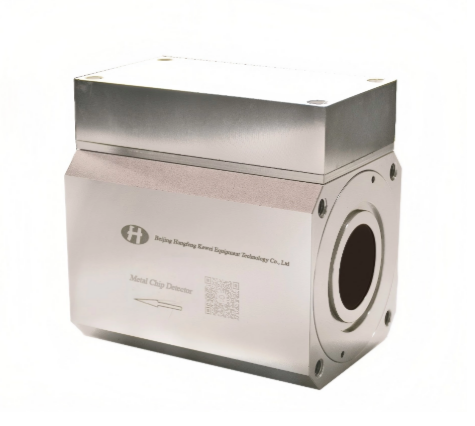
Traditional offline laboratory analysis offers incredible diagnostic depth. Experts evaluate chemical degradation and fluid viscosity loss. Yet, it operates on a severe time delay. We refer to this as the lagging indicator problem. Maintenance teams typically pull oil samples monthly. They mail these bottles to remote laboratories. The lab then conducts Inductively Coupled Plasma (ICP) spectroscopy. Days or even weeks pass before you receive the final PDF report. By the time you review the data, the machine state has already changed. You are reacting to historical facts, not current operational reality. This delay creates massive vulnerability for high-speed gearboxes and turbines.
Mechanical degradation does not follow a neat monthly schedule. Bearing spalling can escalate rapidly. Gear micropitting often starts small but multiplies quickly under high dynamic loads. A bearing might begin shedding microscopic steel flakes just five days after your last oil sample. This early-stage wear goes completely unnoticed by your team. Over the next twenty days, those micro-particles act like sandpaper. They gouge internal metal surfaces. They accelerate the wear cycle exponentially. The component reaches catastrophic failure long before the next scheduled sample. The standard 30-day testing window becomes a dangerous gamble.
Uncertainty drives up operational costs significantly. Relying purely on historical data increases the risk of secondary component damage. A single failing bearing releases hard debris. This debris then destroys downstream proportional valves and hydraulic seals. The mechanical damage multiplies. Furthermore, uncertainty leads to wasteful maintenance practices. Teams perform time-based oil replacements just to feel safe. They discard perfectly viable lubricants. They waste valuable labor hours changing fluids blindly. Real-time data eliminates this costly guesswork entirely.
You must understand how continuous sensors function internally. The online debris monitor dc series relies on advanced inductive or optical measurement principles. It detects, sizes, and classifies individual particles directly within active fluid streams. Inductive sensors utilize specialized electromagnetic coils. Fluid flows directly through the sensor tube and passes through this magnetic field. Metallic particles disrupt the field momentarily. The sensor detects this tiny disruption instantly. It registers the particle size based on the signal amplitude. The entire process requires zero human intervention.
Modern industrial facilities require connected data ecosystems. The monitor continuously feeds particulate trend data into existing dashboards. This integration transitions your facility toward true predictive maintenance. You connect the sensor directly to your SCADA system or CMMS platform. The sensor pushes data around the clock. Maintenance planners observe real-time trend lines on their screens. When particle counts spike abnormally, the system triggers an automatic alert. You stop relying on manual data entry and start leveraging automated data flow.
Not all metal debris indicates the same root cause. The monitor provides massive diagnostic value by separating metallic wear types. Ferrous particles disrupt the magnetic field differently than non-ferrous particles. The internal electronics easily tell them apart. This separation isolates specific degrading components effectively. For example, a sudden spike in ferrous debris usually points to steel gears. Conversely, a spike in non-ferrous debris might indicate wearing bronze bushings or brass bearing cages. Implementing an oil debris monitor gives you a targeted suspect list before you even open the gearbox housing.
You cannot simply attach a sensor to any random pipe. You must evaluate fluid and system compatibility rigorously. Define your necessary operational thresholds clearly prior to purchase. This includes identifying acceptable viscosity ranges. High-viscosity industrial gear oils flow much differently than thin hydraulic fluids. Sensors possess specific operating pressure limits. You also need to account for strict flow rate dependencies. If the oil moves too slowly, heavy particles might settle out of suspension. If it moves too quickly, the sensor might miss the smallest debris. Accurate readings demand proper hydraulic conditions.
| Evaluation Parameter | Key Consideration | Impact on Performance |
|---|---|---|
| Fluid Viscosity | Cst rating of the target oil | Determines flow speed and particle suspension capabilities. |
| System Pressure | Maximum operating bar/PSI | Prevents sensor housing rupture or internal seal failure. |
| Environmental Noise | Vibration and aeration levels | Dictates the need for advanced digital filtering algorithms. |
| Data Output | Analog vs. Digital protocol | Ensures seamless integration into existing PLC networks. |
Engineering always involves complex trade-offs. You face a constant battle between high sensitivity and environmental noise. A premium wear particle monitor detects extremely tiny micro-particles. However, ultra-high sensitivity can trigger frustrating false positives. Fluid aeration introduces tiny air bubbles into the stream. Water contamination creates temporary emulsions. Heavy machine vibration introduces electrical signal noise. The sensor must distinguish between a destructive metal flake and a harmless air bubble. You must choose a sensor featuring robust noise-cancellation algorithms.
Hardware capabilities mean nothing without solid data communication. You must evaluate the data protocol standards carefully. Look closely at the integration capabilities of the device. Your sensor must output data in standard industrial formats. Common analog outputs include 4-20mA signals. Digital options frequently include Modbus RTU, Modbus TCP, and CANopen. Ensure the sensor protocol strictly matches your existing PLC network architecture. Mismatched protocols require expensive third-party gateways and needlessly complicate the entire installation process.
Where you physically install the sensor matters immensely. You generally choose between inline installation and kidney-loop bypass installations. You must balance fluid flow dynamics against pressure drop considerations for each unique asset.
Inline Installation: This method places the sensor directly into the main fluid flow path. It successfully captures 100% of the active fluid. However, it introduces potential pressure drops and requires heavy-duty housing.
Kidney-Loop Installation: This method bypasses the main line entirely. It takes a small, controlled side stream. This avoids main-line pressure issues but only samples a fraction of the total fluid volume over time.
Many reliability teams fail during the initial software setup phase. They activate the sensor and immediately set rigid alarm limits. This represents a critical common mistake. You must establish proper operational baselines first. Warn your team against immediate alarm activation. We stress the absolute necessity of a 30-to-60-day run-in period. Every machine generates a different "normal" background wear rate. A large mining crusher generates more ambient debris than a precision steam turbine. Let the sensor collect data quietly for a month. Determine the baseline average first. Only then should you set standard deviation alarms.
Real-time sensors are not magical, maintenance-free devices. An online oil sensor requires periodic care. It lives in a harsh, heavily contaminated environment. Over time, industrial sludge can build up inside the measuring tube. You must plan for periodic validation checks. Schedule routine calibration verifications annually. You might need to perform occasional chemical cleaning flushes to maintain measurement integrity. Ignoring routine sensor maintenance leads directly to signal drift and highly unreliable trend data.
You need to justify the initial hardware investment. Frame your primary return metric around hard cost avoidance. The ultimate goal remains the prevention of catastrophic mechanical failures. Calculate the replacement cost of a ruined gearbox or damaged turbine. Add the financial penalty of lost production during unplanned downtime. Compare that massive figure against the upfront hardware cost of the sensor. The math heavily favors continuous monitoring. A single caught failure easily pays for the entire monitoring program.
Asset Protection: Elimination of secondary downstream component destruction.
Inventory Control: Reduction of emergency expedited shipping for expensive spare parts.
Uptime Preservation: Prevention of catastrophic, multi-day production line halts.
Technology should ultimately free up your technical workforce. Continuous monitoring drives massive maintenance labor optimization. Technicians no longer waste hours walking the plant floor collecting oil in tiny plastic bottles. They spend their valuable time actually fixing known issues. Real-time data also eliminates premature preventative part replacements. You stop replacing perfectly healthy bearings merely because they hit a specific runtime hour threshold.
Industrial lubricants represent a massive recurring expense. Environmental disposal adds even more overhead. Verifiable fluid cleanliness data allows operators to safely extend oil drain intervals. You only change the oil when the data proves it is heavily contaminated. A well-placed hydraulic oil monitor provides this exact verification continuously. This data-driven approach drastically reduces bulk lubricant spend. It cuts down hazardous waste disposal costs efficiently. Extending your fluid lifecycle directly boosts your facility's bottom line.
Continuous monitoring provides an unmatched strategic advantage for high-criticality industrial assets. It forcefully shifts your maintenance department from blind guesswork to absolute certainty. Real-time wear data allows you to intervene precisely when early-stage degradation begins, preventing catastrophic equipment failure.
Do not attempt to monitor every machine at once. We strongly advise starting with a localized pilot program. Install the monitor on a single known "bad actor" asset first. Validate the baseline data accuracy. Confirm your network integration functions smoothly before pursuing plant-wide scaling.
Your clear next step is to evaluate your current fluid system schematics. Compare your pipe sizes, operating pressures, and fluid viscosity ratings against manufacturer sensor installation requirements.
A: A standard particle counter measures the total amount of dirt and debris to assign an ISO cleanliness code. It cannot identify the material. An advanced online oil sensor differentiates specific wear metal types, such as ferrous versus non-ferrous particles. It sizes them directly, providing clear indicators of active machine component failure rather than just general fluid contamination.
A: It confidently replaces routine particulate and wear metal sampling. It catches transient wear events instantly. However, annual or bi-annual laboratory analysis remains highly recommended. Labs test for chemical degradation, oxidation, water content, and additive depletion checks, which physical debris monitors do not measure.
A: The optimal location is post-component but pre-filter on the return line. Placing the sensor immediately after a critical bearing or gearset captures the most accurate representation of active wear. If you place it after the system filter, the filter will trap the evidence before the sensor can detect the failure.


